The most important capability of an incident response team is to identify attackers in your network. To gain access to financial data, steal user information, or cause general harm, attackers operate in many ways including malware, command-and-control, data exfiltration, credential theft, and more.
Watch our on demand webinar to learn how you can threat hunt at scale and speed with Panther.
In modern companies with high adoption of cloud and SaaS services, data lives in a wide variety of systems and applications that attackers can exploit. Security teams are tasked with collecting all of this data (which is growing exponentially) and transforming it in a way that is conducive to threat detection.
There are two main ways to identify attackers: Detections and Threat Hunting. Detections are the continuous analysis of log data matched against known attacker patterns, while threat hunting involves searching your collection of logs for an indication that a compromise has occurred. These defender tactics are typically coupled together but can also work independently.
To make both of these strategies successful, your security data has to be centralized, normalized, and stored in a manner that supports fast queries and advanced analysis. In this blog post, I’ll explain how to identify attacker behaviors and how Panther can help your team threat hunt at scale.
Traditionally, threat hunting focused on identifying an attack after it occurred. This is more reactive than proactive. According to the 2020 Data Breach Report by IBM Security, the average time to identify a breach is 206 days, and then an additional 73 days to contain it! Failing to take proactive measures can be costly financially and result in loss of customer trust. A proactive approach to threat hunting can reduce the time it takes to identify a breach and can help you better understand what normal and abnormal activity looks like within your environment.
Proactive threat hunting starts with good security data. By using the tactics detailed in this blog, you can gain an upper hand against sophisticated attackers and improve the security posture of your organization.
When we “threat hunt”, what are we looking for exactly? Well, we’re trying to find “hits” for malicious behaviors wherever they may exist.
For example, if an attacker compromises employee credentials to a single sign-on (SSO) service (like Okta, OneLogin, etc.), they can access all authorized pages of that employee. Using atomic indicators, such as the IP from which the attacker accessed the service, we can build a story and trace back what happened. From there, we can pivot to other data sets to find related activity and answer the question: “what did the attacker do once they got in?”
These initial signals are a great place to start, but how can you effectively search through your data to find all of the subsequent activity?
One of the big challenges with security data is normalizing and extracting indicators from logs to enable actionability in detections and hunting. Most security tools leave data normalization to the user to handle, but in Panther, all logs are automatically converted into a strict schema that enables detections with Python and queries with SQL.
For example, if we start with a highly unstructured data type like Syslog:
<85>1 2020-04-29T19:08:54.610771+00:00 ip-172-31-33-197 sudo - - - ubuntu : TTY=pts/0 ; PWD=/home/ubuntu ; USER=root ; COMMAND=/bin/echo testCode language: YAML (yaml)Panther will normalize this data into the following JSON structure:
{
"host": "ip-172-31-33-197",
"ident": "sudo",
"message": "ubuntu : TTY=pts/0 ; PWD=/home/ubuntu ; USER=root ; COMMAND=/bin/echo test",
"time": "2020-04-29 19:08:54.000",
"tag": "syslog.authpriv.notice",
"p_log_type": "Fluentd.Syslog3164",
"p_row_id": "566305b620caded2949b86ad02fd57",
"p_event_time": "2020-04-29 19:08:54.000",
"p_parse_time": "2020-04-29 19:10:41.311",
"p_any_domain_names": "[ip-172-31-33-197]",
"p_rule_id": "FluentdSyslog.Sudo",
"p_alert_id": "cd09c675601e5e90caa8243b6ee3ce03",
"p_alert_creation_time": "2020-04-29 19:10:41.545",
"p_alert_update_time": "2020-04-29 19:10:41.545",
"year": 2020,
"month": 4,
"day": 29,
"hour": 19
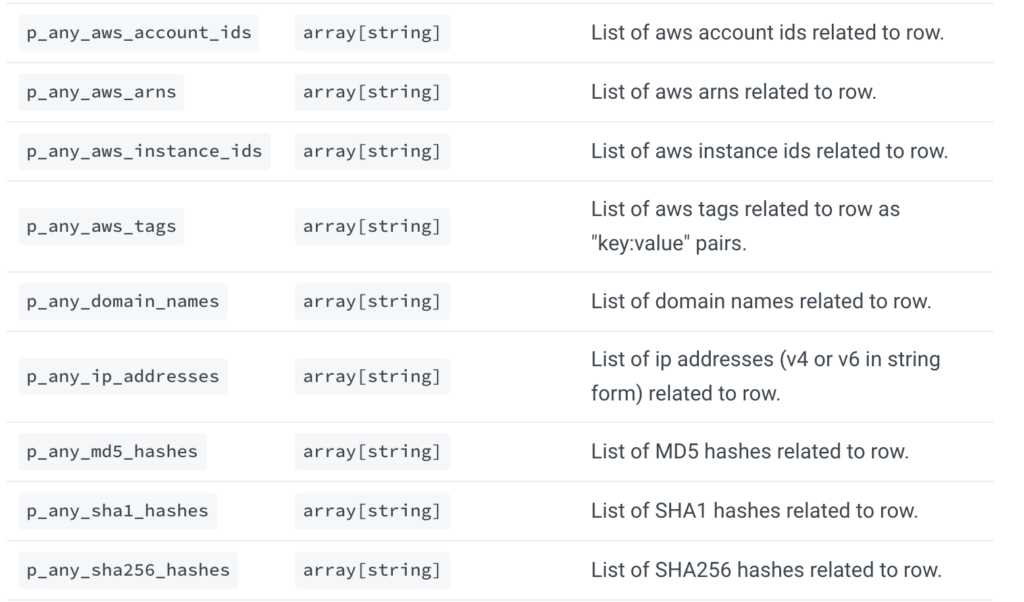
}Code language: JSON / JSON with Comments (json)As you can see, helpful indicators like event time, domain name, and log type are extracted into “p_” fields, which are the “Panther Standard Fields” that enable a security team to hunt for threats and correlate activity.
Let’s take a richer log type as a second example, such as AWS CloudTrail, which has the following structure by default:
{
  "Records": [
    {
	"awsRegion": "us-east-1",
	"eventID": "9379cb71-c31f-4e45-836d-2d7f054fa43d",
	"eventName": "DescribeInstances",
	"eventSource": "ec2.amazonaws.com",
	"eventTime": "2020-11-03T23:58:01Z",
	"eventType": "AwsApiCall",
	"eventVersion": "1.05",
	"recipientAccountId": "123456789012",
	"requestID": "9379cb71-c31f-4e45-836d-2d7f054fa43d",
	"requestParameters": {},
	"sourceIPAddress": "136.24.77.200",
	"userAgent": "console.ec2.amazonaws.com",
	"userIdentity": {
		"type": "Root",
		"principalId": "111111111111",
		"arn": "arn:aws:iam::111111111111:root",
		"accountId": "111111111111",
		"accessKeyId": "AAAASSSSTTTTXXXXKFFF",
		"userName": "panther-test",
		"sessionContext": {
			"attributes": {
				"mfaAuthenticated": "true",
				"creationDate": "2020-11-04T22:24:32Z"
			},
			"sessionIssuer": {},
			"webIdFederationData": {}
		}
	}
    }
  ]
}
Code language: JSON / JSON with Comments (json)
After normalization with Panther, the same AWS CloudTrail log now looks like this:
{
	"awsRegion": "us-east-1",
	"eventID": "9379cb71-c31f-4e45-836d-2d7f054fa43d",
	"eventName": "DescribeInstances",
	"eventSource": "ec2.amazonaws.com",
	"eventTime": "2020-11-03T23:58:01Z",
	"eventType": "AwsApiCall",
	"eventVersion": "1.05",
	"recipientAccountId": "123456789012",
	"requestID": "9379cb71-c31f-4e45-836d-2d7f054fa43d",
	"requestParameters": {},
	"sourceIPAddress": "136.24.77.200",
	"userAgent": "console.ec2.amazonaws.com",
	"userIdentity": {
		"type": "Root",
		"principalId": "111111111111",
		"arn": "arn:aws:iam::111111111111:root",
		"accountId": "111111111111",
		"accessKeyId": "AAAASSSSTTTTXXXXKFFF",
		"userName": "panther-test",
		"sessionContext": {
			"attributes": {
				"mfaAuthenticated": "true",
				"creationDate": "2020-11-04T22:24:32Z"
			},
			"sessionIssuer": {},
			"webIdFederationData": {}
		}
	},
	"p_any_ip_addresses": [
		"136.24.77.200"
	],
	"p_any_aws_account_ids": [
		"123456789012"
	],
	"p_any_aws_arns": [
		"arn:aws:iam::111111111111:root"
	]
}Code language: JSON / JSON with Comments (json)
Now, this normalized data (including the p_ fields) can be searched with SQL in Panther’s Data Explorer, organized into tables by their classified log type (e.g. CloudTrail, VPC Flow, Syslog) and databases by the result of processing (i.e. all logs, rule matches, or metadata):
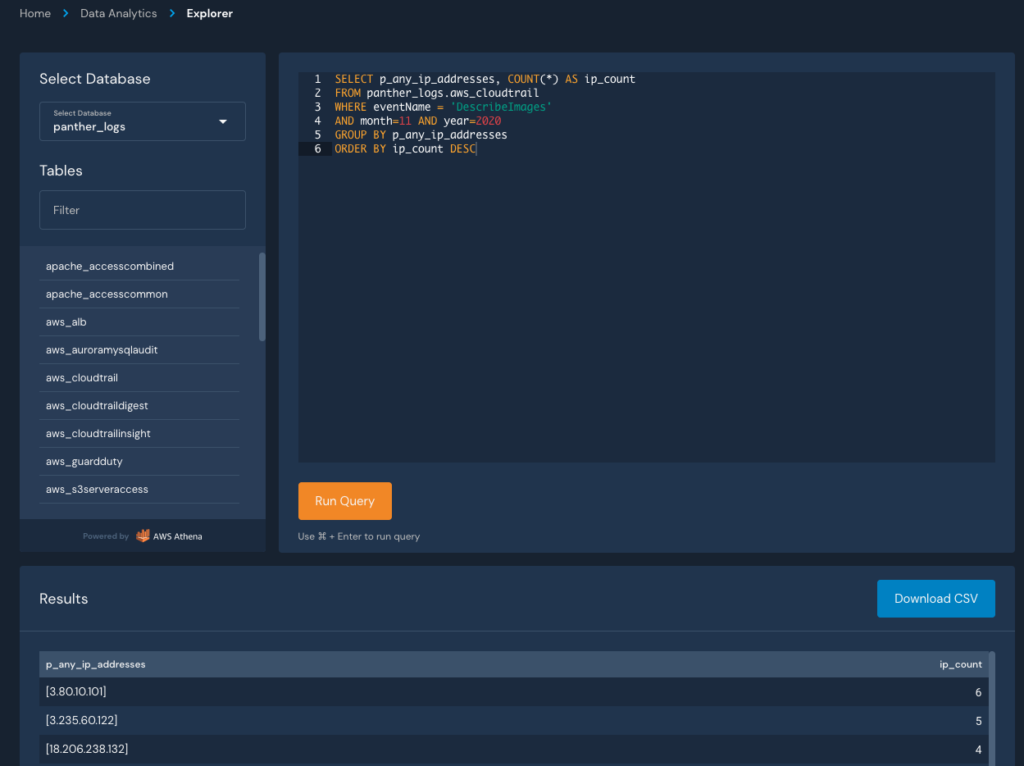
This SQL shell provides power and flexibility in data analytics, but what if we wanted to search for hits across all of our data sources? This is where Panther’s indicator search comes in!
To correlate indicators across all of your normalized logs, you can use the Indicator Search. It’s a great starting point for proactive hunting or triaging a generated alert.
Typical indicator fields include IPs, Domains, Usernames, or anything that can be correlated as the result of a string of related activity. Take SSH traffic, for example. When a user connects to a new host, their IP address is present in the netflow data (Layer 3 or 7 network traffic) and the SSH session (syslog). Using the Indicator Search, you can identify these links within a given timeframe and find related activity to answer questions in an investigation.
In this example, let’s find associated hits for the past week from the IP extracted in the CloudTrail event above:
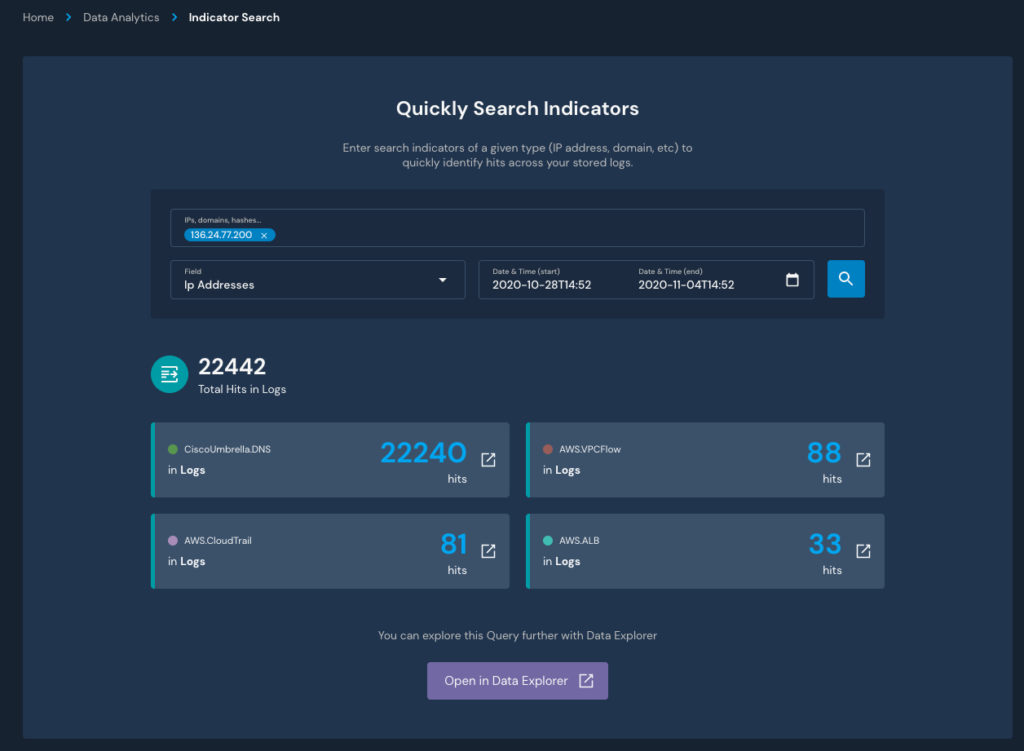
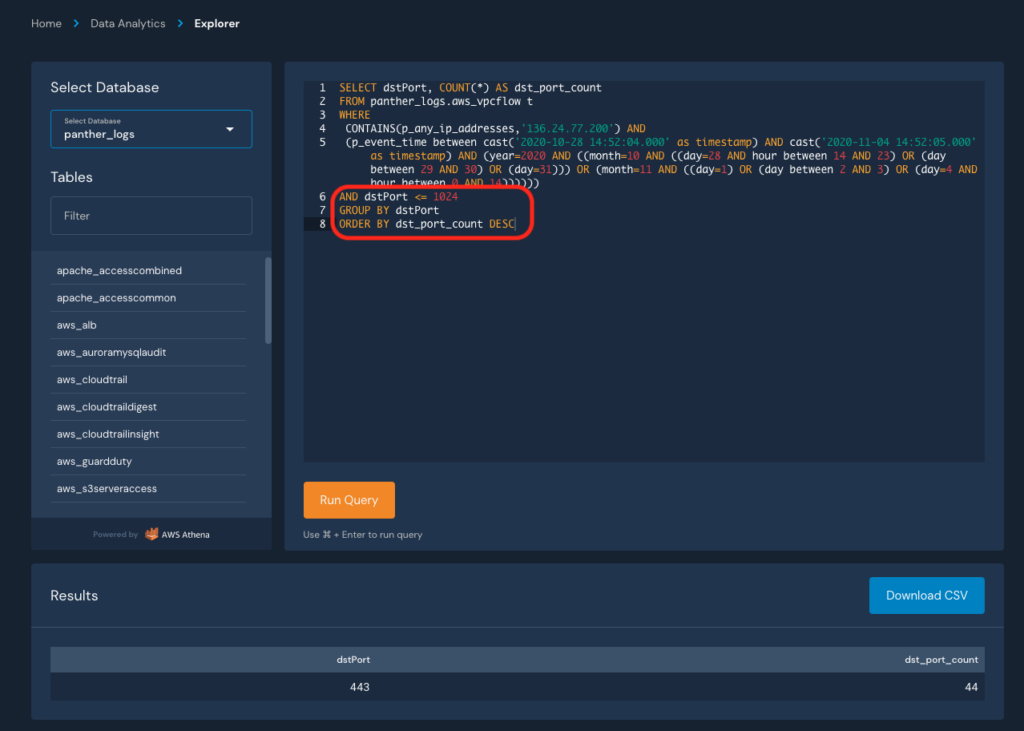
If we click any of the arrows to see the hits, we’ll get redirected to Panther’s Data Explorer with an automatically generated SQL query to get directly to the data:
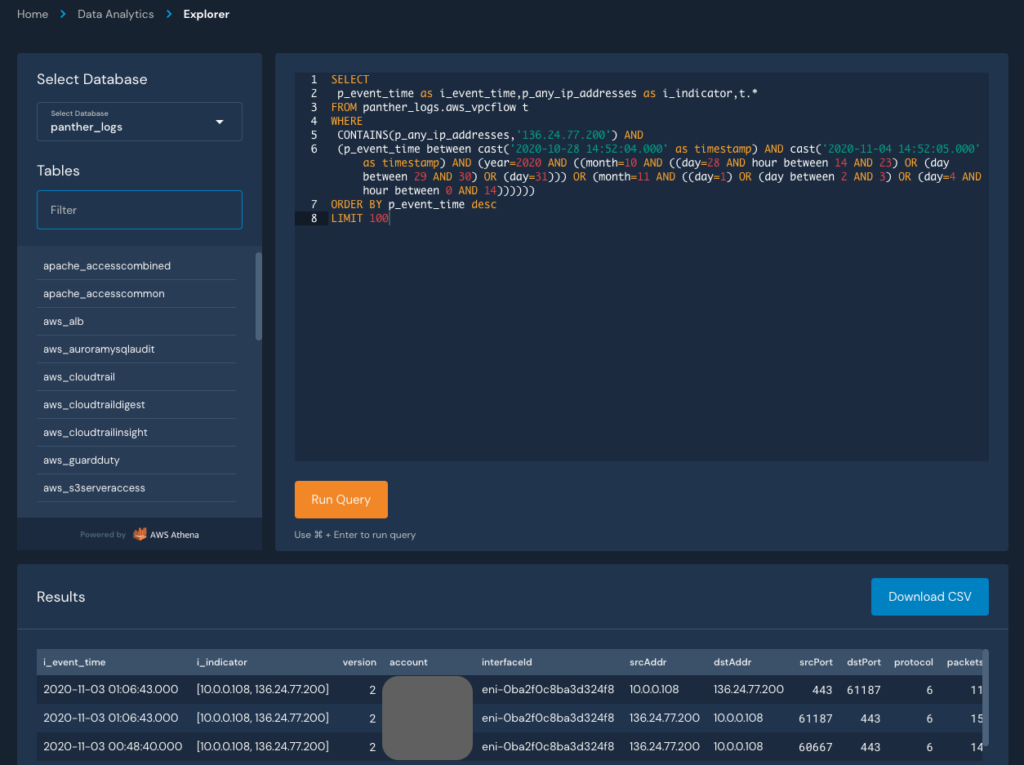
From here, we can modify the query to search for specific behaviors, such as the distinct destination ports accessed:
This pattern of detecting, searching, pivoting, and refining can be repeated until you’ve answered all of the pertinent questions in your investigation. Findings can also be exported as CSV to store in your incident management system.
In this blog, we demonstrated how you can use structured data, SQL queries, and normalized indicators to stitch together a complete picture of an incident that touched multiple systems. Two recent and notable additions in Panther to further improve this workflow are support for custom logs, which significantly increase the types of data you can send to Panther, and integrations with new SaaS log sources, like Crowdstrike, which pull data directly from APIs.
At the end of the day, any seasoned security practitioner will tell you that good security starts with good data – that’s why we built Panther’s data infrastructure on proven big data patterns that offer better performance at scale than traditional SIEMs. And that’s also why Panther integrates with Snowflake to provide security teams a best-of-breed data warehouse to power robust investigations against huge volumes of data.
To learn more about how your team can build a world-class security program around terabytes of centralized and normalized data, watch our on demand webinar: Threat Hunting at Scale with Panther.