Osquery is a powerful, host-based application that exposes the operating system as a set of SQLite tables. Security teams use osquery to track activity in their fleet such as user logins, installed programs, running processes, network connections, or system log collection.
In this tutorial, we will walk through how to configure osquery with Panther to create an end-to-end security alerting pipeline to send logs for analysis and then notifying your team on a specific activity. Panther also comes with pre-installed rules based on default query packs, which provides value for most osquery deployments.
For the purpose of this tutorial, we will assume an osquery installation on Ubuntu 18.04. This tutorial was last updated in February 2021.
To install osquery, follow the instructions here. Osquery can be installed on Mac, Linux, or Windows.
Osquery periodically reports data by querying specific tables and sending results in JSON format to the configured logger_plugin(s), which can be the filesystem, a TLS endpoint, or AWS. The osquery.conf controls these settings, including other daemon (osqueryd) behaviors.
For example, the following query output can display all currently logged in
osquery> SELECT * FROM logged_in_users WHERE type ='user';
+------+--------+-------+----------------+------------+-------+
| type | user   | tty   | host           | time       | pid   |
+------+--------+-------+----------------+------------+-------+
| user | ubuntu | pts/0 | 228.192.69.179 | 1585784433 | 19761 |
+------+--------+-------+----------------+------------+-------+Code language: Shell Session (shell)
To schedule this query, we add it into the schedule in our osquery.conf:
{
  "schedule": {
    "logged_in_users": {
      "query": "SELECT * FROM logged_in_users WHERE type ='user'",
      "interval": 3600
    }
  }
}Code language: JSON / JSON with Comments (json)
When this query runs (every 3600 seconds), it will report results in a JSON log:
      {
        "name": "logged_in_users",
        "action": "added",
        "hostIdentifier": "prod-host-01",
        "columns": {
          "type": "user",
          "user": "ubuntu",
          "tty": "pts/0",
          "host": "228.192.69.179",
          "time": "1585784433",
          "pid": "19761"
        }
      }Code language: JSON / JSON with Comments (json)
columns are the results of the query we see abovename is the descriptor for the scheduled queryaction indicates if this result is being added or removedhostIdentifier is the hostname which reported the logWhen Panther receives the log, it will be parsed, extracted, and normalized based on fields such as IPs/domains to enable quick searches in the data warehouse and flexibility in rules. For the complete list of all fields parsed by Panther, check out the Osquery.Differential reference.
Let’s assume that we are sending osquery data from an Ubuntu machine in an AWS VPC.
To send to Panther, we will use the aws_firehose logger plugin. To provide the correct credentials, we will also use an IAM role and a Firehose Delivery Stream which will end up in an S3 bucket. The template here can be used to create the necessary infrastructure to enable this flow.
The /var/osquery/osquery.conf example below can be used to get started:
{
  "options": {
    "config_plugin": "filesystem",
    "logger_plugin": "aws_firehose",
    "aws_firehose_stream": "<NAME-OF-FIREHOSE-DELIVERY-STREAM>",
    "aws_region": "<AWS-REGION>",
    "aws_sts_arn_role": "<AWS-IAM-ROLE-ARN>",
    "aws_sts_region": "<AWS-REGION-TO-ASSUME-ROLE>",
    "aws_sts_session_name": "<STS-SESSION-NAME>",
    "schedule_splay_percent": "10",
    "utc": "true"
  },
  "schedule": {
    "logged_in_users": {
      "query": "SELECT * FROM logged_in_users WHERE type ='user'",
      "interval": 3600
    }
  },
  "decorators": {
    "load": [
      "SELECT uuid AS host_uuid FROM system_info;",
      "SELECT user AS username FROM logged_in_users ORDER BY time DESC LIMIT 1;"
    ]
  },
  "packs": {
    "osquery-monitoring": "/usr/share/osquery/packs/osquery-monitoring.conf",
    "incident-response": "/usr/share/osquery/packs/incident-response.conf",
    "it-compliance": "/usr/share/osquery/packs/it-compliance.conf",
    "vuln-management": "/usr/share/osquery/packs/vuln-management.conf",
    "hardware-monitoring": "/usr/share/osquery/packs/hardware-monitoring.conf",
    "ossec-rootkit": "/usr/share/osquery/packs/ossec-rootkit.conf"
  }
}Code language: JSON / JSON with Comments (json)
This configuration: Loads sample packs to provide a great baseline across many tables Adds decorations to all logs, which provides additional helpful context Assumes an IAM role, and sends to a Firehose delivery stream periodically
This pattern is easily scalable across a fleet of thousands of AWS VMs and can be customized to meet your needs.
To add your own queries, either write your own pack or simply add new queries to the schedule in the configuration above.
Follow this procedure to send Osquery data to Panther.
Once your desired osquery configuration is in place, make sure to restart the osquery daemon. Also ensure that it is running with no errors. On Ubuntu, this looks like:
 sudo systemctl status osqueryd.service
● osqueryd.service - The osquery Daemon
   Loaded: loaded (/usr/lib/systemd/system/osqueryd.service; disabled; vendor preset: enabled)
   Active: active (running) since Thu 2020-03-26 00:58:11 UTC; 6 days ago
 Main PID: 6071 (osqueryd)
    Tasks: 15 (limit: 1152)
   CGroup: /system.slice/osqueryd.service
           ├─6071 /usr/bin/osqueryd --flagfile /etc/osquery/osquery.flags --config_path /etc/osquery/osquery.conf
           └─6077 /usr/bin/osquerydCode language: Shell Session (shell)
In the CloudWatch dashboard, you would begin to see metrics for the created DeliveryStream for IncomingRecords:
Now with data flowing, let’s onboard the S3 bucket containing osquery data into Panther.
From Log Analysis > Sources, click Add Source:
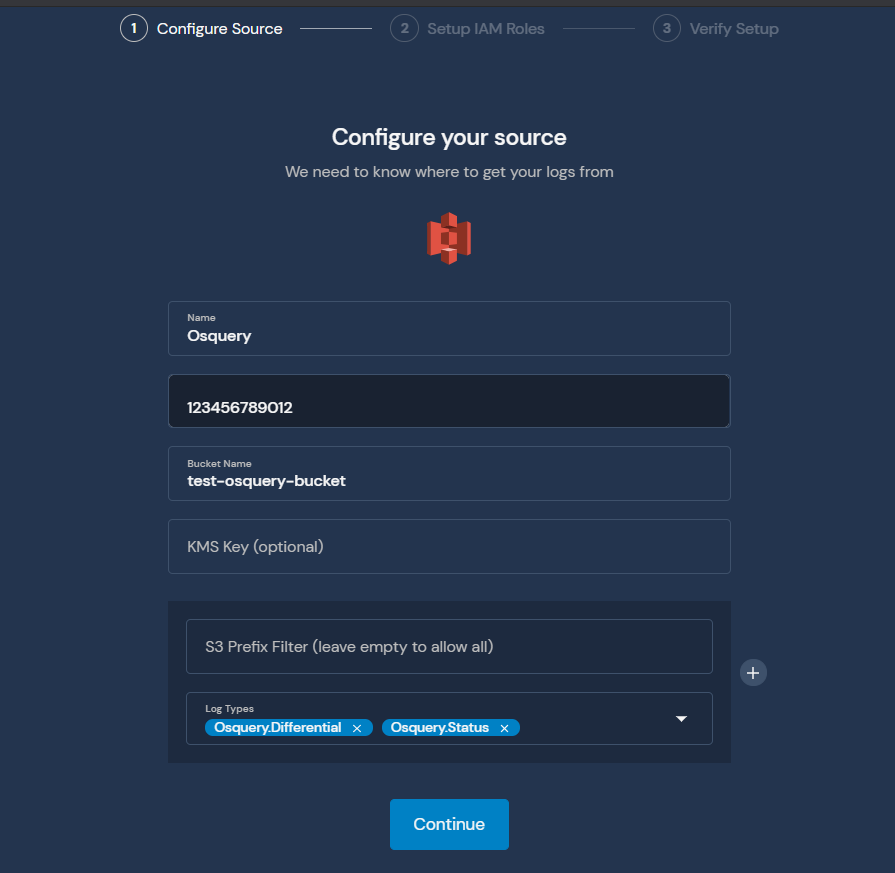
Note the Log Types in the screenshot above. If you plan to send Osquery logs either in Batch or Snapshot mode, make sure to add the log types in the initial screen.
Follow the instructions to create the IAM role to allow Panther to pull the data.
Then, save the source, and enable the notifications to onboard osquery data.
If everything is working, you should now see data in the ”panther_logs”.”osquery_differential” table in Athena:
SELECT DISTINCT name
FROM "panther_logs"."osquery_differential"
WHERE month=4 AND day=1;Code language: SQL (Structured Query Language) (sql)
1 pack_osquery-monitoring_osquery_info
2 pack_it-compliance_mounts
3 pack_it-compliance_deb_packages
4 pack_incident-response_last
5 pack_osquery-monitoring_schedule
6 pack_incident-response_process_memory
7 pack_incident-response_open_files
8 pack_incident-response_process_env
9 pack_incident-response_shell_history
10 pack_vuln-management_deb_packagesCode language: YAML (yaml)It may take up 15 minutes before data is searchable in Athena.
Before writing any rules against osquery data, make sure to configure your alert destinations. This will provide a quick feedback loop on the rules written.
Panther supports four types of osquery log schemas:
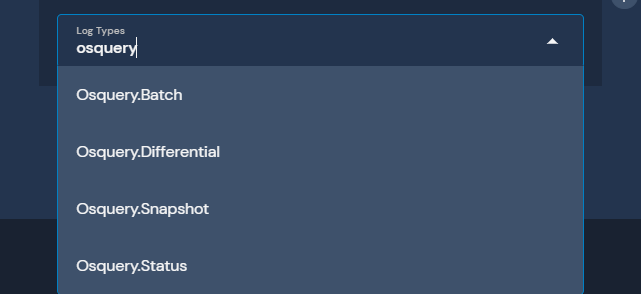
For most installations, Differential and Status will be the main two formats used unless specifically set in the configuration. Check out the osquery docs to learn more.
Panther ships by default with several built-in example osquery rules that can also be used as a guide while writing your own.
There are two methods of analyzing osquery logs: alerting on any query results or analyzing the output of a query.
Generally, this method is used when a very specific query is written, for example:
SELECT *
  FROM users
JOIN chrome_extensions
USING (uid)
  WHERE identifier='hinehnlkkmckjblijjpbpamhljokoohh'Code language: SQL (Structured Query Language) (sql)
Note: This query is taken from the
MacOSInstallCorequery in theunwanted-chrome-extensionspack that ships with osquery.
When analyzing results from this pack, we can assume that any result would be suspicious or have a higher likelihood of being a true positive. Thus, we can write the subsequent Panther rule:
def rule(event):
    return ('unwanted-chrome-extensions' in event['name'] and
            event['action'] == 'added')


def dedup(event):
    return event['hostIdentifier']


def title(event):
    return 'Unwanted chrome extension(s) detected on {}'.format(
            event['hostIdentifier'])Code language: Python (python)
The rule is analyzing that query results came from a query in the unwanted-chrome-extensions pack and the action is in the ”added” state, meaning that new data was detected.
The second method of osquery log analysis is making a generic query, and using Python to further filter the output and identify something potentially suspicious.
For example, in the built-in incident-response pack for Linux, there’s a crontab query:
SELECT *
FROM crontab;Code language: SQL (Structured Query Language) (sql)
And some example output:
osquery> SELECT command,path FROM crontab;
+---------------------------------------------------------------------------------------------------------------------------------------------------------+--------------------------------+
| command                                                                                                                                                 | path                           |
+---------------------------------------------------------------------------------------------------------------------------------------------------------+--------------------------------+
| root cd / && run-parts --report /etc/cron.hourly                                                                                                        | /etc/crontab                   |
| root test -x /usr/sbin/anacron || ( cd / && run-parts --report /etc/cron.daily )                                                                        | /etc/crontab                   |
| root test -x /usr/sbin/anacron || ( cd / && run-parts --report /etc/cron.weekly )                                                                       | /etc/crontab                   |
| root test -x /usr/sbin/anacron || ( cd / && run-parts --report /etc/cron.monthly )                                                                      | /etc/crontab                   |
| root if [ -x /usr/share/mdadm/checkarray ] && [ $(date +\%d) -le 7 ]; then /usr/share/mdadm/checkarray --cron --all --idle --quiet; fi                  | /etc/cron.d/mdadm              |
| root [ -x /usr/lib/php/sessionclean ] && if [ ! -d /run/systemd/system ]; then /usr/lib/php/sessionclean; fi                                            | /etc/cron.d/php                |
| root test -x /etc/cron.daily/popularity-contest && /etc/cron.daily/popularity-contest --crond                                                           | /etc/cron.d/popularity-contest |
| smmsp test -x /etc/init.d/sendmail && test -x /usr/share/sendmail/sendmail && test -x /usr/lib/sm.bin/sendmail && /usr/share/sendmail/sendmail cron-msp | /etc/cron.d/sendmail           |
+---------------------------------------------------------------------------------------------------------------------------------------------------------+--------------------------------+Code language: Shell Session (shell)
Let’s write a rule to detect a cron that loads something from /tmp/ (which is typical for malware):
def rule(event):
    # Make sure we are analyzing the right query output
    if 'crontab' not in event['name']:
        return False

    # Check that a command is provided
    command = event['columns'].get('command')
    if not command:
        return False

    # Analyze any presence of the string /tmp/ in the rule
    if '/tmp/' in command:
        return True

    # If these conditions aren’t satisfied, do not trigger an alert
    return False


def dedup(event):
    return event.get('hostIdentifier')


def title(event):
    return 'Suspicious cron found on {}'.format(event.get('hostIdentifier'))Code language: Python (python)
This is just a simple implementation. The beauty of Python is that you can get as sophisticated as you would like. This includes using libraries like shlex to look deeper at the cron commands and much more.
There are a couple of caveats when writing rules on osquery data:
The first is that it’s entirely possible that we will miss certain activity between the query windows. One way around this limitation is to shorten the query window. The downside is that it has a potential performance hit, especially at scale. Another solution is to use tables that hook into process events.
The other caveat is that you may run into a situation where osquery is sending “old” logs, either from shell_history or last. One way around this limitation is by analyzing the epoch time, and making sure it’s within the last 24h or whatever your query window is set to (plus/minus about 30 minutes to account for splay + data landing in S3).